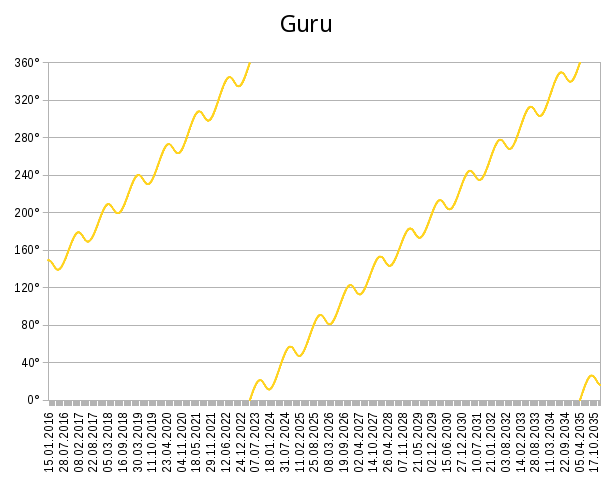
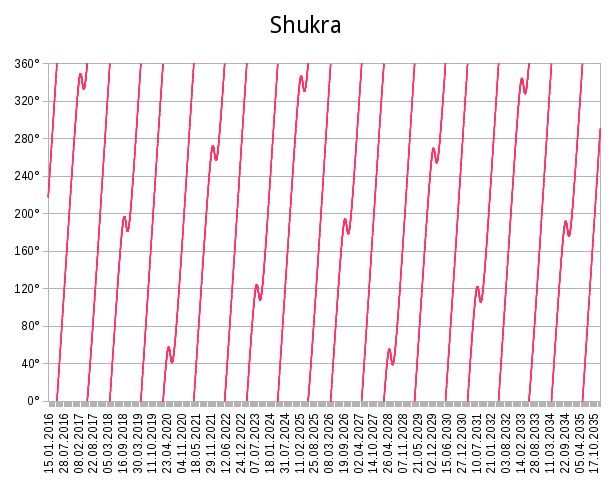
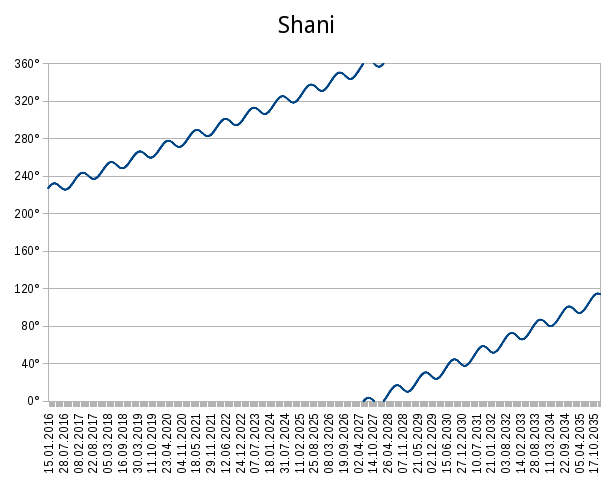
We have recently published a blog post with retrograde motion calendar for the next five years. There was a table giving dates when grahas become retrograde and direct again. From that table, it might have been a bit hard to infer whether there is any pattern to how they change direction. In this blog post, we illustrate each graha’s motion for the next twenty years in graphical form, making it easy to see that each graha has a rather regular and unique motion pattern. This blog post thus serves as a nice complement to the calendar post and retrograde motion statistics provided therein.
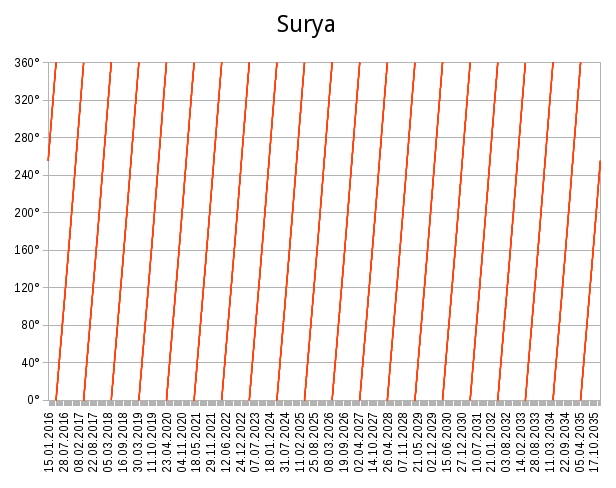
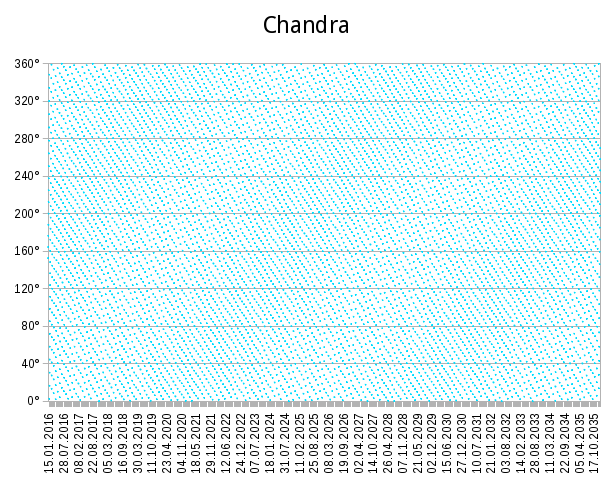
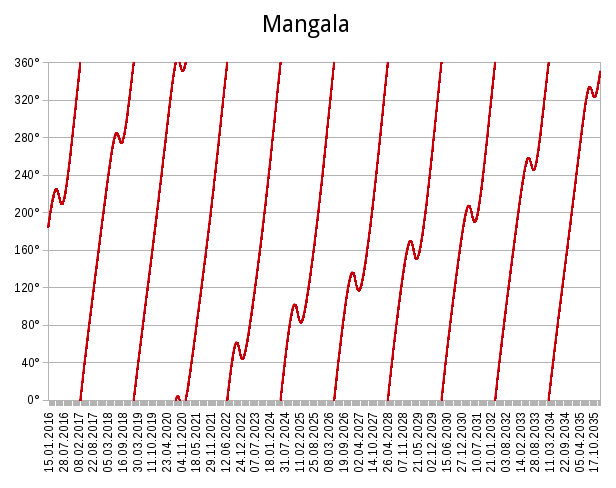
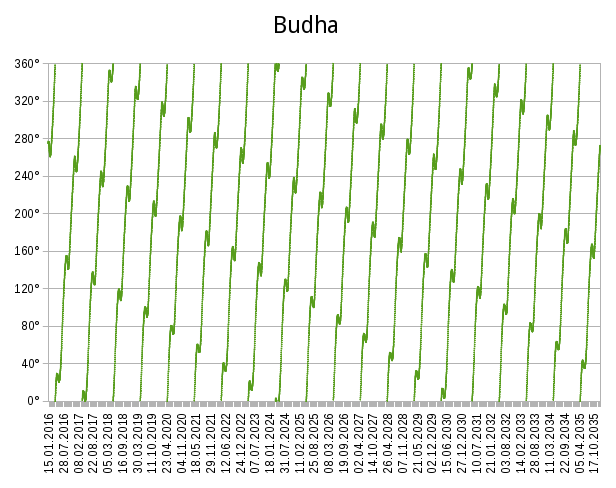
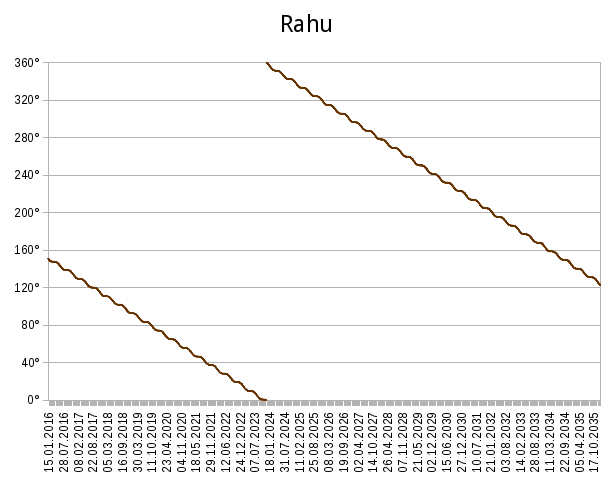
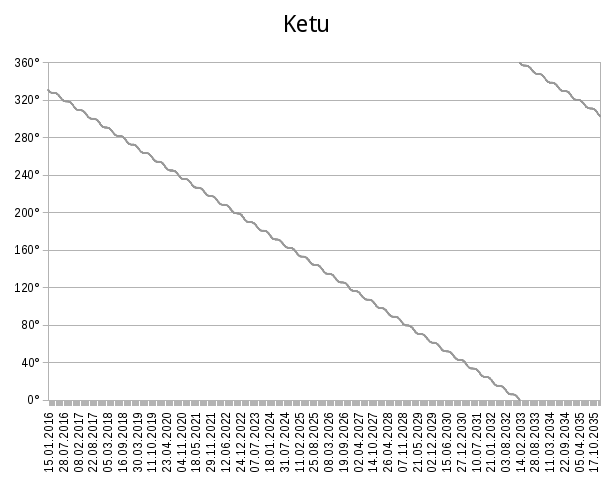
For each graha, there is a chart below with graphical ephemeris for years 2016 to 2035, showing the paths they take. For the fast-moving Candra, which makes a full cycle twelve times per year, it was a bit hard to provide a precise graph at the scale needed for this blog post, so we include a nice approximate graph for completeness. For Rāhu and Ketu, the wavy nature of the lines is explained by the fact that we used true nodes for this presentation and true nodes frequently move in direct motion: